07-07-2026
4 minute read
When the lights went out across the Iberian Peninsula on April 28, 2025, it wasn’t just a power failure. It was tens of millions of people suddenly disconnected from modern life. Homes went dark, trains came to a halt mid‑route, airports slowed or shut down and hospitals switched to emergency power.
Mobile networks degraded, and entire cities lost visibility into what was happening or why. In total, around 60 million people across Spain and Portugal were impacted – not for seconds, but for hours in some regions. This wasn’t just a blackout. It was a systemic failure with human consequences.
Large‑scale blackouts don’t begin when the power disappears. They begin hours, days, or even weeks earlier, as subtle electrical instabilities accumulate:
These signals rarely trigger traditional SCADA or protection alarms. They remain buried in aggregated RMS values or averaged reports.
But they are visible – if you know where to look.
Post‑event analysis shows that before the blackout hit Spain and Portugal, the grid began showing clear indicators of stress:
None of these individually causes a blackout. Together, unchecked, they create the perfect conditions for one. These weren’t post‑event artifacts. They were the early warning signals – the kind that conventional triggered meters often miss.
This is exactly where advanced power quality analyzers change the outcome. Elspec’s continuous waveform recording power quality analyzers, monitored and recorded every second of this critical pre‑collapse window with full resolution.
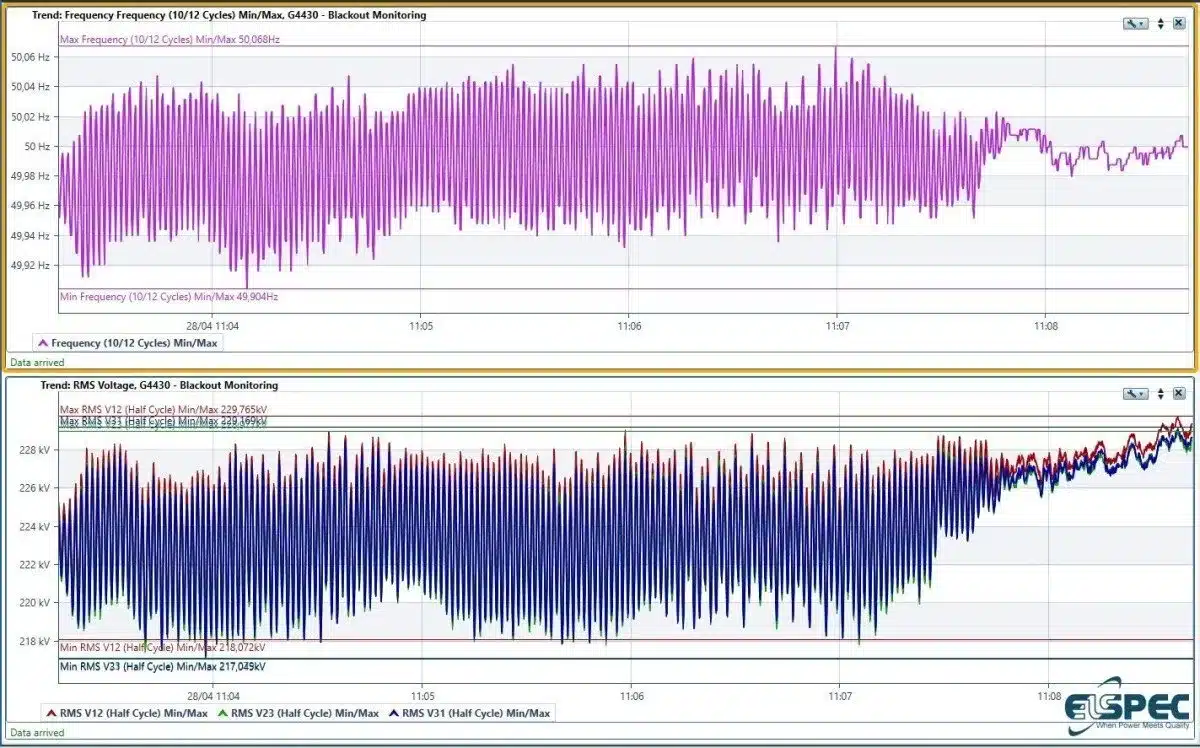
Figure 1: Time series of grid frequency showing growing oscillations prior to blackout.
Frequency Oscillations Intensify Minutes Before the Collapse – Continuous frequency tracking reveals rising oscillation amplitude approaching the event window.
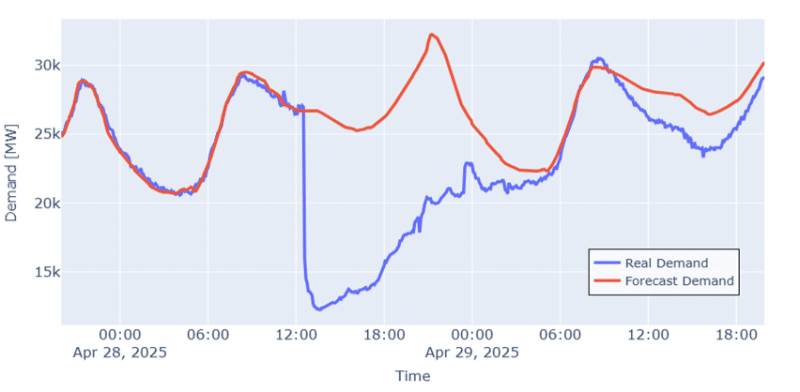
Figure 2 Source: Prof Mario Mañana Canteli elaboration based on data from Spanish TSO presented at Elspec UGM2025
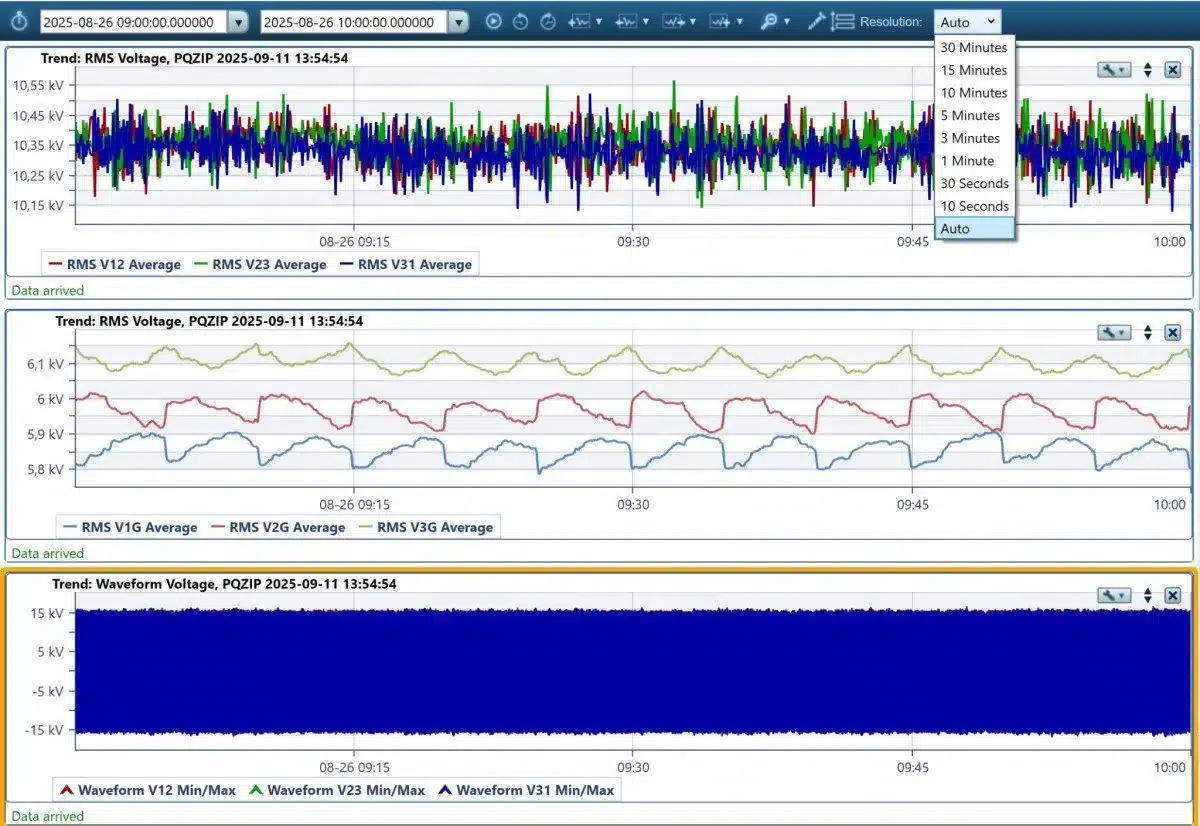
As frequency became more unstable, RMS voltage began showing widening envelopes, indicating a loss of damping and system rigidity.
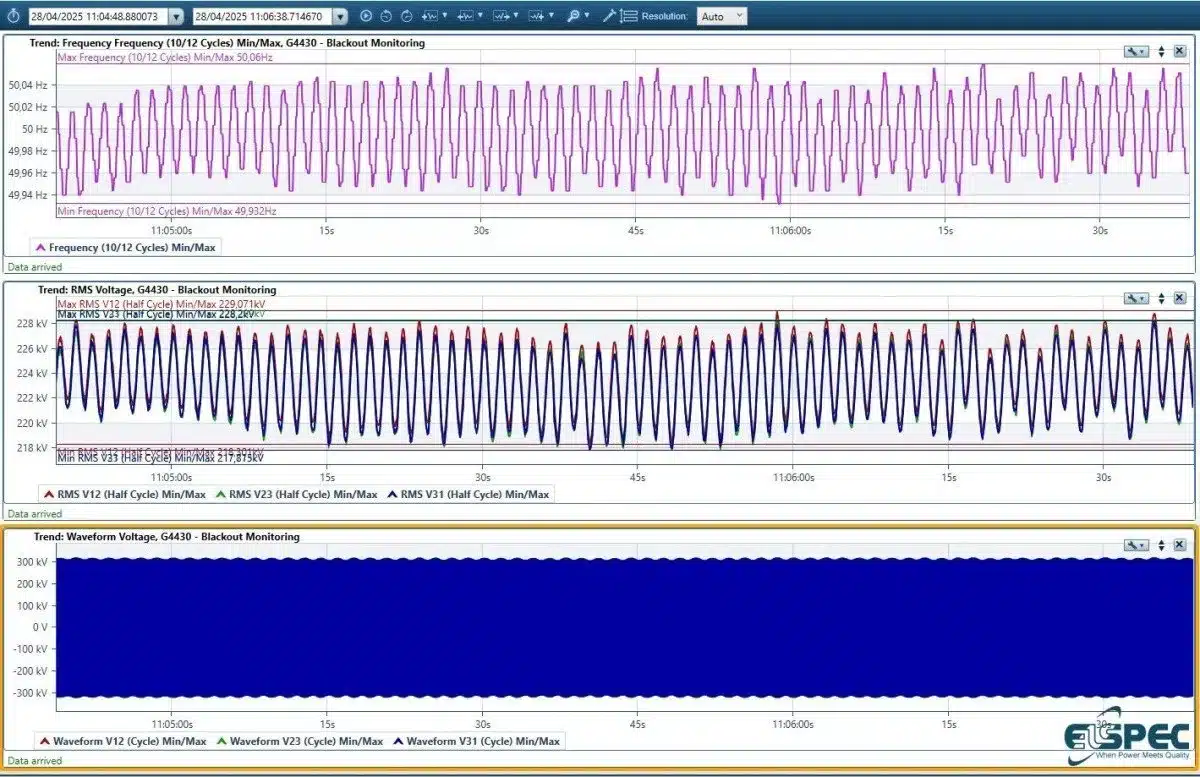
Figure 3: Voltage divergence across phases a clear indicator of a grid under stress.
Elspec power quality analyzers captured the full waveform timeline, showing exactly when instability became uncontrollable.
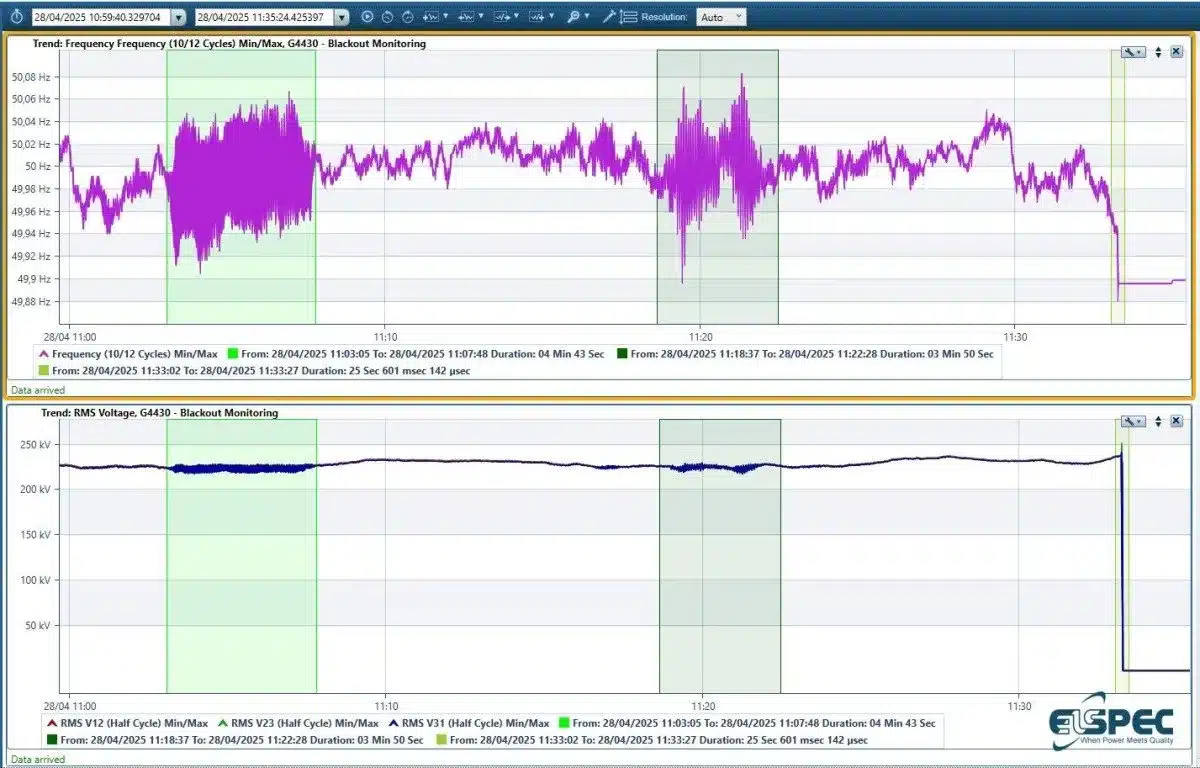
Figure 4: Green bands mark the exact minutes leading to the collapse, captured without gaps.
As the collapse propagated, facilities across the Iberian Peninsula tripped offline within seconds.
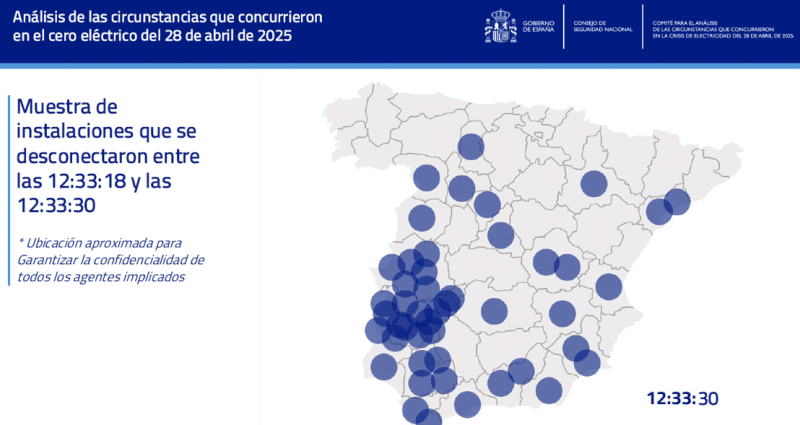
Geographic Distribution of Disconnections (12:33:18–12:33:30)
This event didn’t come out of nowhere. The grid was signaling distress before the blackout occurred.
Most grids today rely on:
This means operators are often flying blind, seeing only the final collapse, not the path leading to it.
This is exactly where advanced power quality analyzers change the outcome.
With the full waveform recording provided by Elspec analyzers, TSOs and power engineers can now:
The Iberian blackout should not be remembered only as a failure. It should be used as a wake‑up call.
As grids become more complex – integrating renewables, power electronics, EVs, and distributed generation – the margin for error shrinks.
You cannot manage what you don’t measure. High‑resolution power quality data is no longer a “nice to have.” It’s a critical reliability layer.
07-07-2026
07-07-2026
30-06-2026

23-06-2026


Account Manager & Application Engineer
Belgium & Luxembourg

