06-10-2026
3 minute read
Power quality issues are often diagnosed using standard reports and compliance‑grade measurements. But what happens when those reports hide the very evidence you need to make the right decision?
A recent case in Denmark perfectly illustrates how relying on averaged data can lead to incorrect conclusions and how high‑resolution, continuous monitoring can reveal the real story behind grid disturbances.
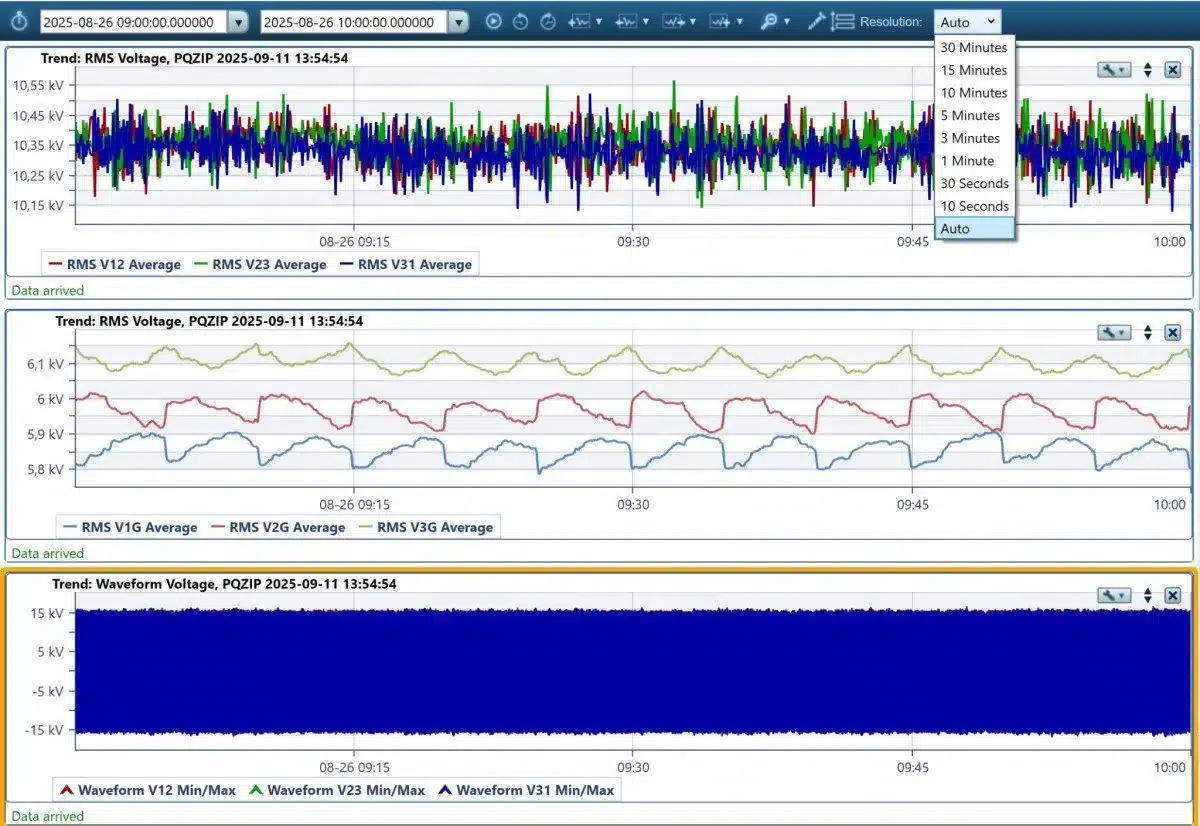
A customer connected a new system to a 10kV distribution grid. Soon after commissioning, initial power quality reports suggested that the system was generating electrical noise on the grid.
Based on this data, it appeared that the customer’s installation was the source of the problem.
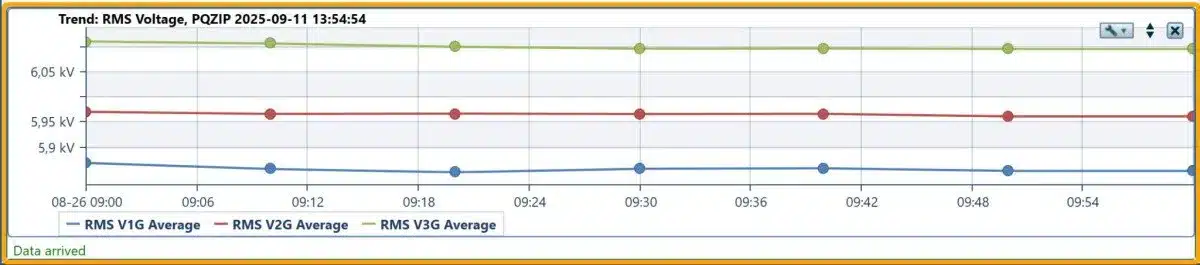
However, these reports were generated using Class A power quality meters that provide 10‑minute averaged values. While compliant with standards, such averages often flatten the data into smooth, uneventful curves – hiding short‑duration disturbances, periodic events, and transient behavior.
Given this limited visibility, the conclusion seemed inevitable – but it was also wrong.
To investigate further, our local agent Eluminate used Elspec G4400 Fixed Power Quality Analyzers together with PQSCADA Sapphire software.
Unlike traditional reporting methods, Elspec’s analyzers operate with continuous, gapless recording, capturing every waveform in real time and storing it for detailed analysis.
This approach made it possible to:
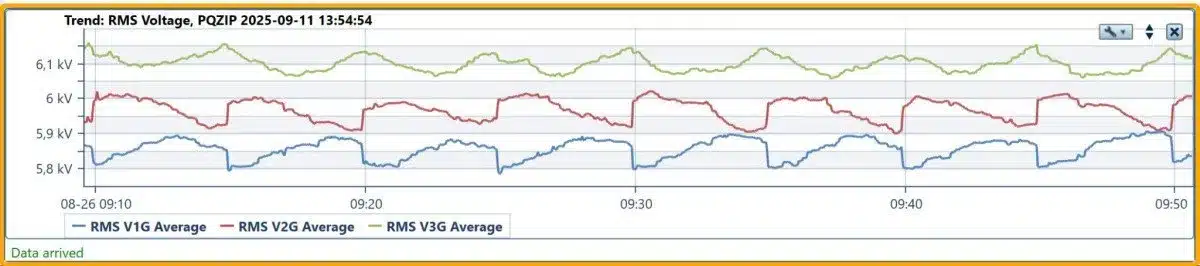
Once the data was analyzed at high resolution, the real source of the issue became clear:
In other words, the customer’s system was not introducing the noise – it merely coincided with an existing grid phenomenon that standard reports failed to expose.
This case highlights a common risk in power quality diagnostics:
When short‑term events are averaged out, critical information disappears.
Without high‑resolution data, engineering teams may:
Accurate diagnosis depends not only on what you measure but how you measure it.
Elspec’s power quality Analyzers and recorders are designed to eliminate blind spots in power quality analysis by providing:
✔ Real‑time, continuous, gapless recording
✔ Instant zoom from long‑term trends to waveform‑level detail
✔ Full visibility into harmonics, RMS variations, transients, flicker, and more
This level of granularity empowers engineers to move from assumptions to evidence and from reaction to confident action.
At Elspec, we help utilities, industrial operators, and grid engineers uncover hidden power quality issues that standard tools simply can’t reveal.
Because when it comes to electrical systems, quality matters – and so does the ability to see it clearly.
06-10-2026
23-09-2026
16-09-2026
16-09-2026




Account Manager & Sr. Application Engineer


